3.1 Measurements and their errors
3.1.1 Use of SI units and their prefixes
SI units
| Quantity | Unit | Symbol |
|---|---|---|
| Mass | kilogram | kg |
| Length | metre | m |
| Time | second | s |
| Current | ampere | A |
| Temperature | kelvin | K |
| Amount of substance | mole | mol |
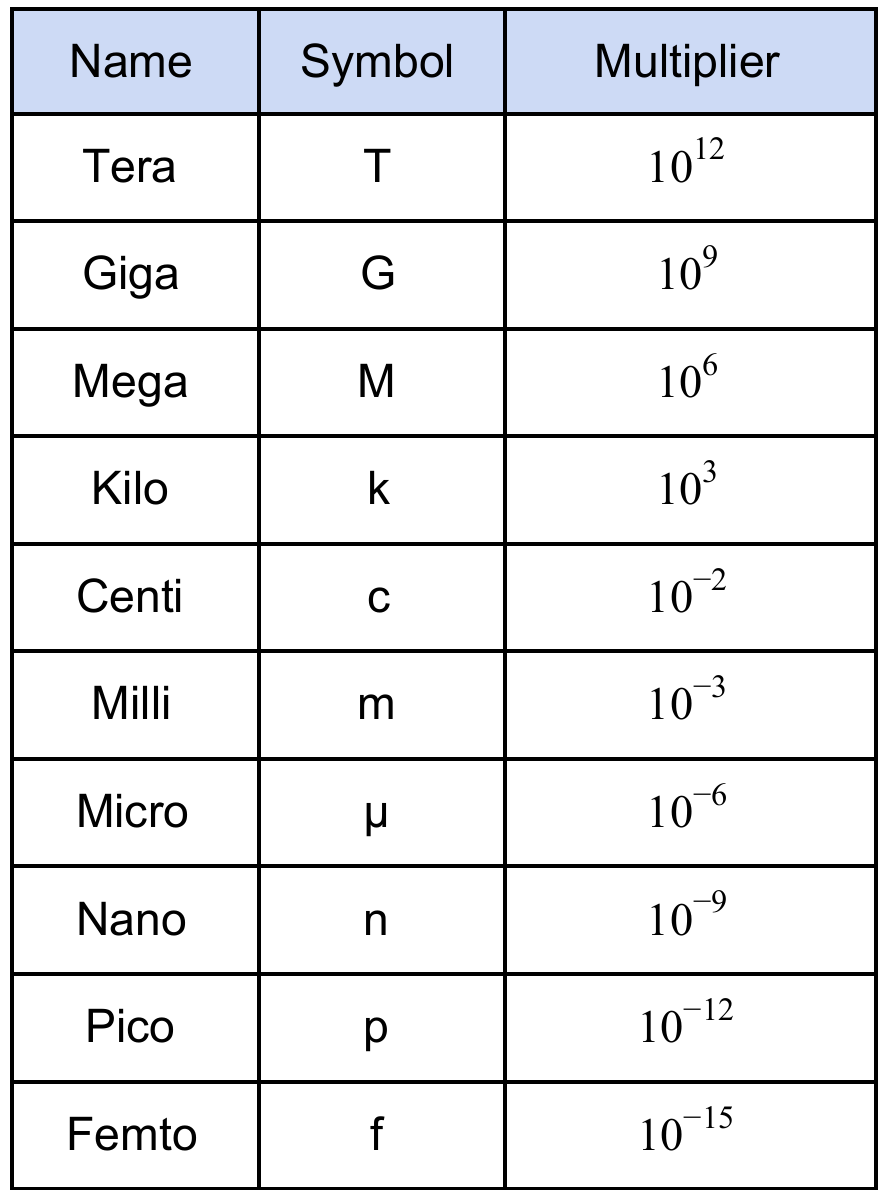
Prefixes
3.1.2 Limitation of physical measurements
Definitions
| Term | Definition |
|---|---|
| Precision of a measurement | Precise measurements = very little spread about the mean value. Depends only on the extend of random error |
| Precision of an instrument / resolution | The smallest non-zero reading that can be measured |
| Repeatability | If the original experimenter can redo the experiment with the same equipment and method and get the same results it is repeatable |
| Reproducibility | If the experiment is redone by a different person or with different techniques and equipment and the same results are found, it is reproducible |
| Accuracy | How close a measurement or answer is to the true value |
Types of errors
- Random errors
- Affect precision, cause differences in measurements
- Cannot get rid of all random errors
- Reducing random errors:
- Take at least 3 repeats and calculate a mean
- Use computers/data loggers/cameras to reduce human error and enable smaller intervals
- Use appropriate equipment
- Take large measurements
- Systematic errors
- Affect accuracy
- Occur due to the faults in apparatus / experimental method
- Causes all results to be too high or too low by the same amount each time
- Types:
- Zero error: balance not zeroed correctly (all increase / decrease by the same amount)
- Parallax error: reading the scale at a different angle than parallel
- Reducing systematic errors:
- Calibrate the apparatus by measuring a known value
- Correct for background radiation for radiation experiments
- Read the meniscus at eye level
- Use controls in experiments
Uncertainty of measurements
- The bounds in which the accurate value can be expected to lie
- Absolute uncertainty: uncertainty given as a fixed quantity e.g. \(7 \pm 0.6 \text{ V}\)
- Fractional uncertainty: uncertainty as a fraction of the measurement e.g. \(7 \pm \frac{3}{35} \text{ V}\)
- Percentage uncertainty: uncertainty as a percentage of the measurement e.g. \(7 \pm 8.6 \% \text{ V}\)
- To reduce percentage and fractional uncertainty: measure larger quantities
- Uncertainty can only be quoted to the same precision as the measuring instrument / same number of decimal places as the data
- Work out uncertainty from the number of decimal places if not specified
Reading
- 1 value is found
- Uncertainty in reading = \(\pm \text{smallest division}\)
Measurement
- The difference between 2 values are found
- Uncertainty in measurement = \(\pm 2 \times \text{smallest division}\)
Uncertainty in different situations
- Digital readings: uncertainty quoted or assumed to be \(\pm\) the last significant digit
- Repeated data: \(\text{uncertainty} = \pm \frac{\text{range}}{2}\)
Uncertainty calculations
- Adding / subtracting data = add absolute uncertainties
- Multiplying / dividing data = add percentage uncertainties
- Raising to a power = multiply percentage uncertainty by power
- Uncertainties given to the same number of sig figs as the data
Uncertainties on graphs
- Uncertainties shown as error bars on graphs
- A line of best fit on a graph should go through all error bars (excluding anomalous points)
Uncertainty of gradient of line of best fit
- Draw a steepest and shallowest line of worst fit (must go through all error bars)
- Calculate the gradient of the line of best and worst fit
- The uncertainty is the difference between the best gradient and the worst gradient (the one with the greatest difference in magnitude from the 'best' line of best fit)
- \(\text{percentage uncertainty} = \frac{\text{maximum gradient} - \text{minimum gradient}}{2} \times 100\%\)
Uncertainty of x and y-intercept
- \(\text{percentage uncertainty} = \frac{\text{maximum y-intercept} - \text{minimum y-intercept}}{2} \times 100\%\)
3.1.3 Estimation of physical quantities
Orders of magnitude
- Powers of 10 which describe the size of a value
- Give a value to the nearest order of magnitude = round to the nearest order of magnitude