5.1.1 How fast
Definitions
| Term | Definition |
|---|---|
| Order | The power to which the concentration of a reactant is raised in the rate equation |
| Overall order | The sum of the individual orders of reactants in the rate equation |
| Rate constant | The constant that links the rate of reaction with the concentrations of the reactants raised to the powers of their orders in the rate equation |
| Initial rate of reaction | The change in the concentration of a reactant or product per unit time at the start of the reaction (\(t=0\)) |
| Rate-determining step (RDS) | The slowest step in the reaction mechanism of a multi-step reaction |
| Molecularity | The number of molecules in the slow rate determining step |
Orders, rate equations and rate constants
Rate of reaction
- \(rate = \frac{\text{change in concentration}}{\text{time}}\)
- Unit = \(mol \cdot dm^{-3} \cdot s^{-1}\)
Order of reaction
- \(rate \propto [A]^n\)
- \(n\) = order of reaction
- Zero order: rate is independent of concentration
- First order: rate is directly proportional to concentration
- Second order: rate is proportional to concentration squared
Rate equation
- \(rate = k [A]^m [B]^n\)
- \(overall \ order = m + n\)
- \(k = rate \ constant\)
- Unit of \(k = mol^{(1-\text{overall order})} \cdot dm^{3 \times (\text{overall order}-1)} \cdot s^{-1}\)
Answer template for determining the orders of reaction
- One change only
- Using experiments X and Y:
- \([A]\) changes from ... to ...: doubled / tripled / etc.
- \([B]\) constant
- Rate doubled / quadrupled / etc.
- Hence the order wrt A is ... order
- Multiple changes - choose 2 experiments where all the concentrations are multiplied by the same amount
- Using experiments X and Y:
- \([A]\) changes from ... to ...: multiplied by \(x\)
- \([B]\) changes from ... to ...: multiplied by \(y\)
- Rate multiplied by \(z\)
- \(z = x^m \times y^n\) (where \(n\) is known from previous step)
- Hence the order wrt B is ...
Monitoring concentration
| Scenario | Method |
|---|---|
| Coloured compounds present | Colorimeter |
| Acidic / alkaline compound present | Monitor pH Use pH meter / titration to determine pH if reaction is slow |
| Gas produced | Measure volume of gas produced / mass loss if gas escapes |
| Aqueous reactions | Measure conductivity |
Rate graphs and orders
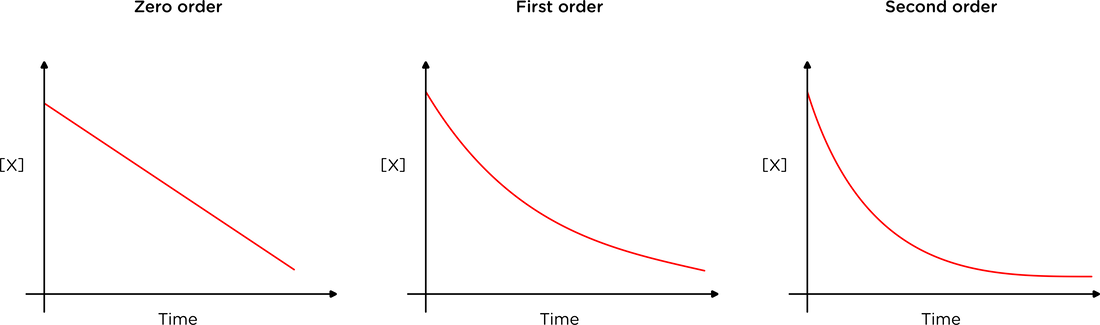
Concentration-time graph shape
- Zero order
- Rate does not change with concentration
- Straight line with negative gradient
- First order
- Downward curve with decreasing gradient over time
- Constant half-life (\(t_{1/2}\))
- \(k = \frac{\ln 2}{t_{1/2}}\) (\(k\) can also be worked out by finding the gradient of the rate-concentration graph)
- Second order
- Rate is directly proportional to the square of concentration
- Downward curve steeper at start + tailing off more slowly
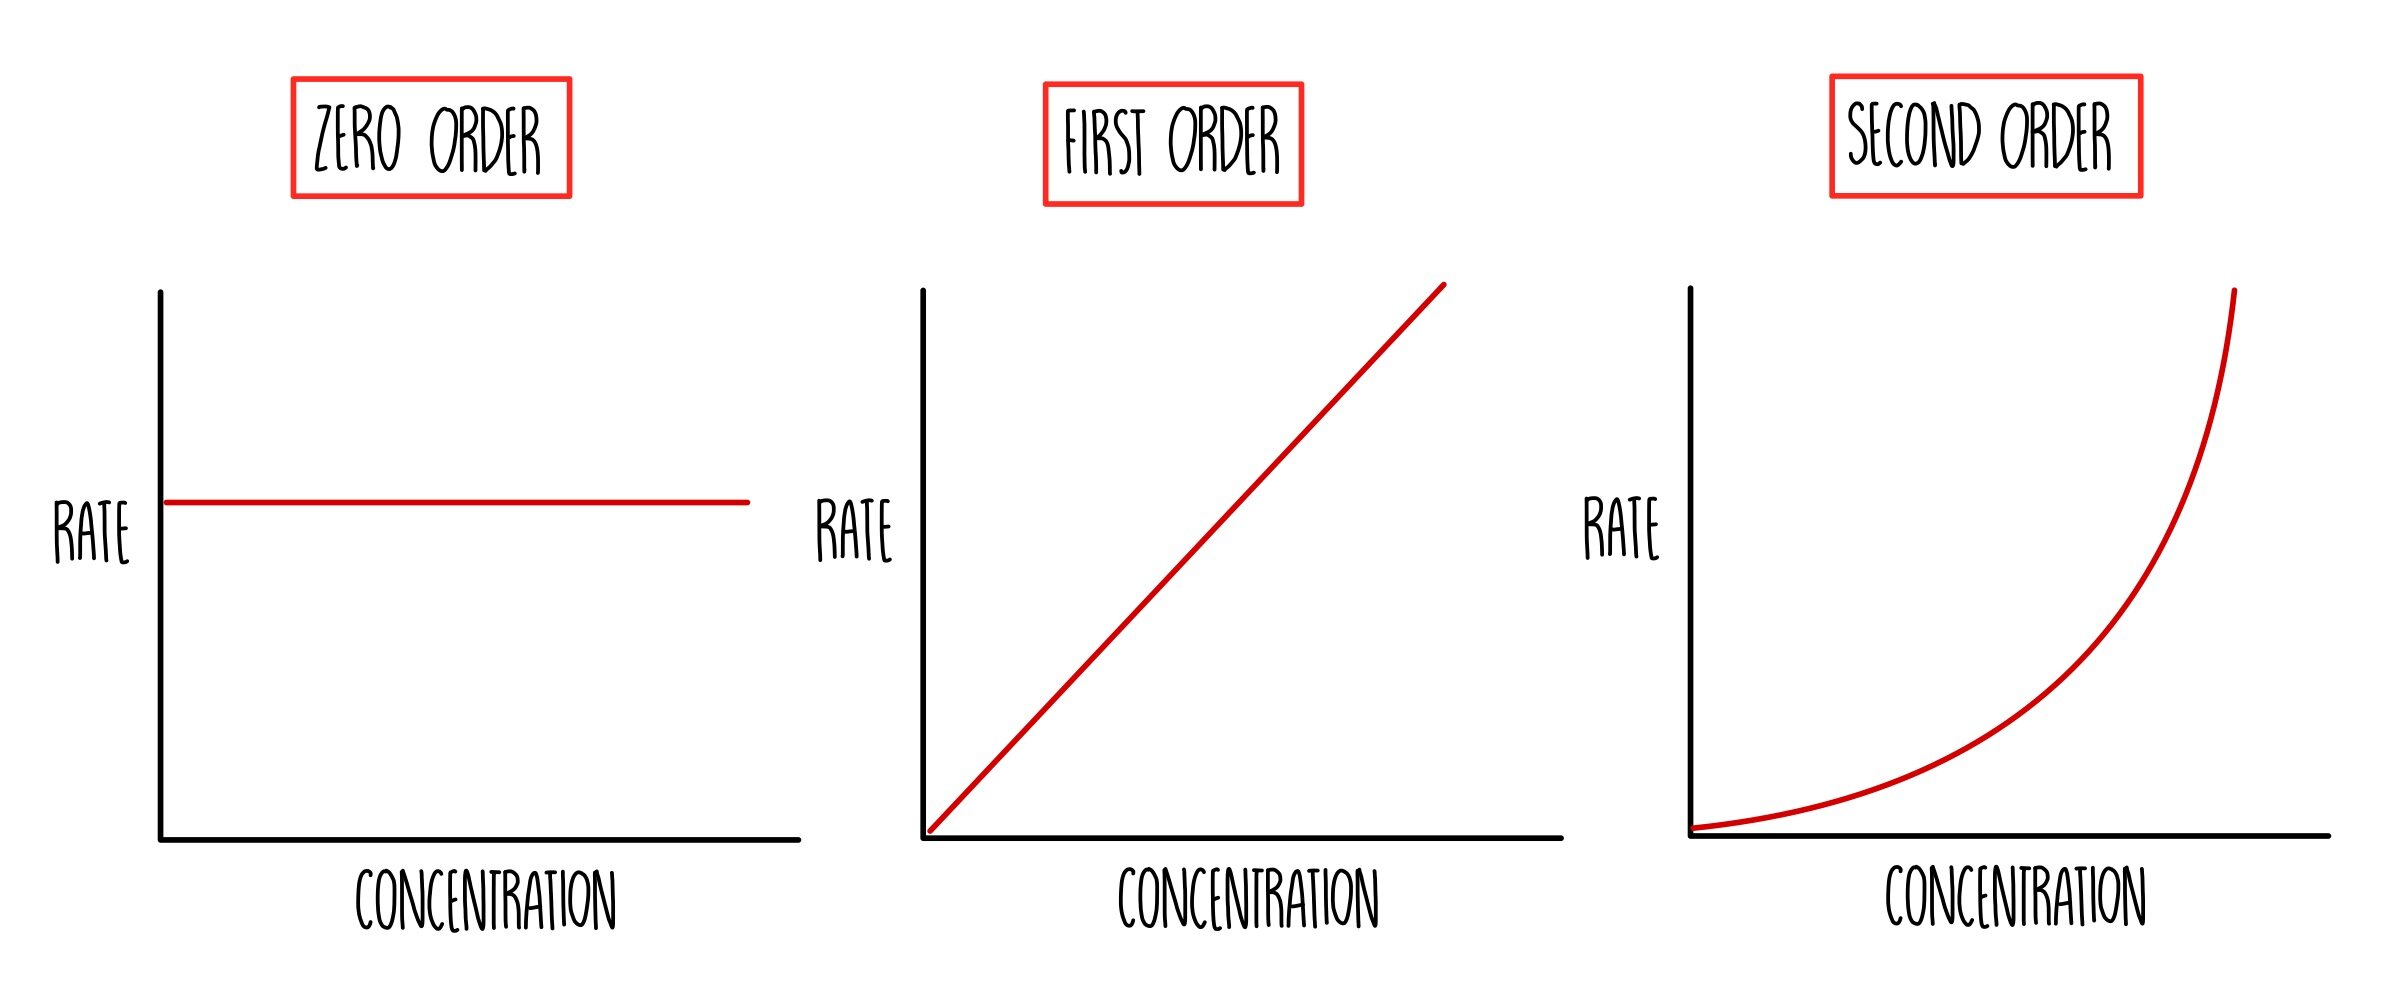
Rate-concentration graph shape
- Zero order
- Horizontal straight line
- Rate = y-intercept = \(k\)
- First order
- Straight-line through origin
- Gradient = \(k\)
- Second order
- Upward curve with increasing gradient
Measuring initial rate with clock reaction
- Several experiments with different concentrations of one reactant, all other reactant concentrations are kept constant
- Time (\(t\)) measured from the start of reaction to when a visual change is observed (colour change / precipitate)
- Initial rate is directly proportional to \(\frac{1}{t}\)
- Iodine clocks
- Measure time taken for iodine colour (orange-brown) to appear
- Colour change is delayed by adding a small amount another chemical that removes iodine as it forms
- Starch can be added to form a blue-black colour
- Plot a graph of \(\frac{1}{t}\) against concentration
- Deduce order of reaction from shape of graph (same as rate-concentration graphs)
- Shorter time = higher accuracy
Rate-determining step
Predicting the rate-determining step (slowest step)
- Reactants only include the species involved in the rate equation
- Stoichiometry in the rate equation should match the stoichiometry in the overall reaction
Effect of temperature on rate constants
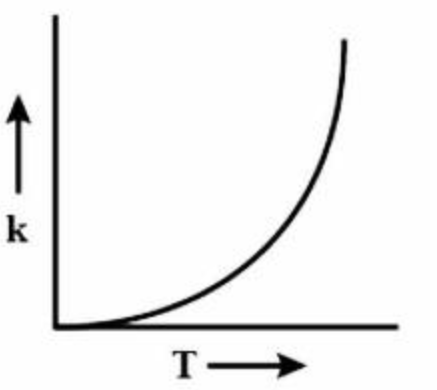
Effect of temperature on rate constants
- Increase temperature = increase \(k\)
- Higher temperature shifts the Boltzmann distribution to the right \(\rightarrow\) higher proportion of particles has a higher energy than \(E_a\)
- Particles move faster + collide more frequently
Arrhenius Equation
- \(k = A e^{-\frac{E_a}{RT}}\)
- \(A = \text{pre-exponential factor / frequency factor}\)
- \(R = \text{ideal gas constant } (8.314 \ J \cdot mol^{-1} \cdot K^{-1})\)
- \(T = \text{temperature } (K)\)
Logarithmic graphs
- \(\ln k = -\frac{E_a}{RT} + \ln A\)
- Graph can be plotted with \(\frac{1}{T}\) on x-axis and \(\ln k\) on y-axis
- Gradient = \(-\frac{E_a}{R}\)
- y-intercept = \(\ln A\)